
Spark Machine Learning
Executive Summary
In this part, we tried to use Spark ML and other machine learning tools to analyze the Reddit Data
of Marvel Studio and some
other related external data. For a film and drama produce company, the reaction and discussion
of audience is the most important and valuable information. We used preprocessed reddit data with
external data sources and tried to train machine learning models to predict important metrics (IMBD
ratings) of evaluating movies and series and we interpret the models in order to get correlational
information about what aspects of a movie/character are most welcomed by common reddit users. The
following paragraphs are the procedure and results of our ML analysis goals.
Marvel Characters & reddit score
Business Goal: How Marvel fans values the comments on Reddit. What are the major factors to affect the score on Marvel subreddits?
On reddit, each comment has a score, calculated by the number of up votes subtracting the down vote. To some degree, score reflects how many users agree with this comment. Using machine learning models to fit the score with some features can help us understand what feature is important in the value and attitudes of Marvel fans. If our model reveals that some heroes or medias showing up is a positive factor on the comment's score, then we can have more business insights step on that. We can figure out some conclusion and suggestions with business values and strategic decision making. For example, character:spider-man is an important feature and based on the model, mentioning spider-man will make the score higher. That means Marvel fans like to talk about spider-man and Marvel Studio can based on this To fit the model, we filter out the sub comments and only use the parent post in our data set. This is because parent post usually have a much higher score compared with the sub comments inside a post. Users are more likely to up vote the main post. The size of our data set comes to 180k rows with 69 features. We will use Spark ML to train, test, tune the hyperparameters and compare different models. In this analysis, we use Linear Regression and Random Forest Regression on the same data, compare the metrics and select the better model. For both models, we split out a validation set to do the hyperparameters tuning.
By fitting the score for each comment, we could be able to fit the comment features with the comment scores. The interpretation of the model can assist us to understand the major factors on the comments score which we believe is a good way to know the values of Marvel fans. We will try to identify some of the features that will positively affect the score or negatively affect the score. This requires the models we used have a high interpretability.
To fit the model, we filter out the sub comments and only use the parent post in our data set. This is because parent post usually have a much higher score compared with the sub comments inside a post. Users are more likely to up vote the main post. The size of our data set comes to 180k rows with 69 features. We will use Spark ML to train, test, tune the hyperparameters and compare different models. In this analysis, we use Linear Regression and Random Forest Regression on the same data, compare the metrics and select the better model. For both models, we split out a validation set to do the hyperparameters tuning.
| Model - Train/Test | RMSE | MAE |
|---|---|---|
| Random Forest - Train | 2204.89 | 495.57 |
| Random Forest - Test | 2266.20 | 498.91 |
| Linear Regression - Train | 2220.80 | 504.34 |
| Linear Regression - Test | 2269.79 | 503.42 |
Based on the metrics, both of the linear and random forest are struggling fitting the data. The random forest regressor outperforms a little bit on the linear regression, based on the RMSE and MAE. But neither of them has a good performance, RMSE is around 2200 for two models and this is far from the distribution of the score in our datasets. The MAE reaches to 500 which is not good either.
This bad performance can be due to the data scale. When data scale is too large, it will bring difficulties to a simple model to fit the whole data set. Since we have over 180k data, we believe this situation can be eased if we pick small amount of data.
From the prediction angle, we should choose random forest regressor since it has lower error. However, the metrics are very close between these two models. We should consider both two models in our analysis part. The interpretation of both two models will contribute to our understanding towards the Marvel fans value on Reddit. One of the best ways to analyze the model is looking into the feature importance.
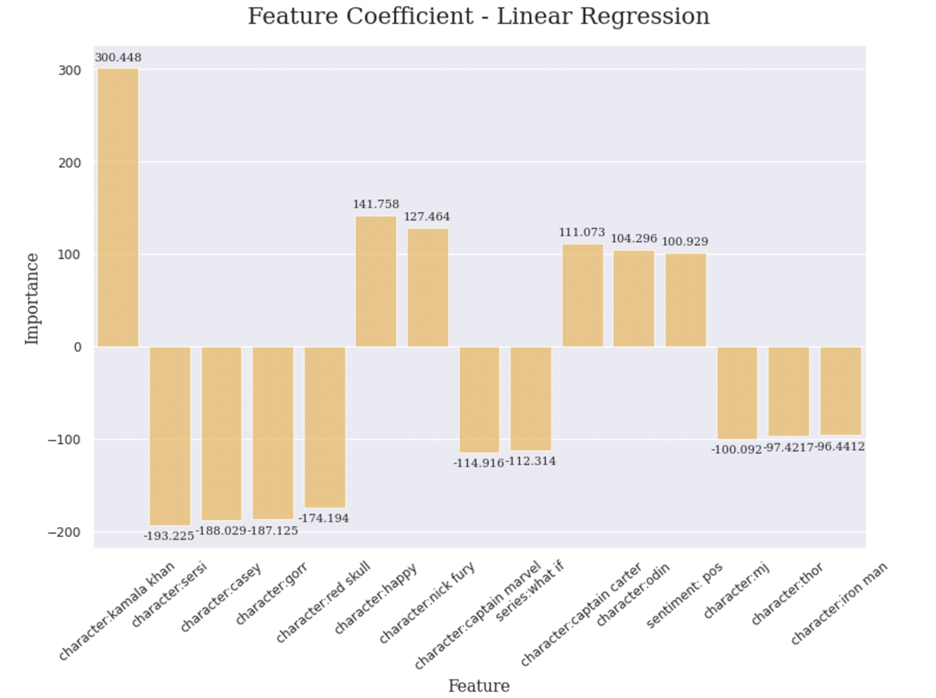
For the linear model, the feature importance is quite simple. The coefficient tells the weight of each feature in the model. The most important feature, based on the chart, is the character:kamala khan, as known as Ms. Marvel. The positive number indicates that we Marvel fans start talking about is character, they can usually receive more up votes and get more score. That also reveals certain values among Marvel fans. Marvel fans like the Ms. Marvel and we Reddit has a post that talks about Ms. Marvel, it will generally have a higher score. While, Ms. Marvel has the popularity, some other heroes or series may not be like this. Sersi, Casey, Gorr and Red Skull, are some characters that will receive down votes. Other features like Nick Fury, Captain Carter, and Odin are some Marvel fans happy to talk about. Captain Marvel and series What if are some that they do not want to pay much attention on.
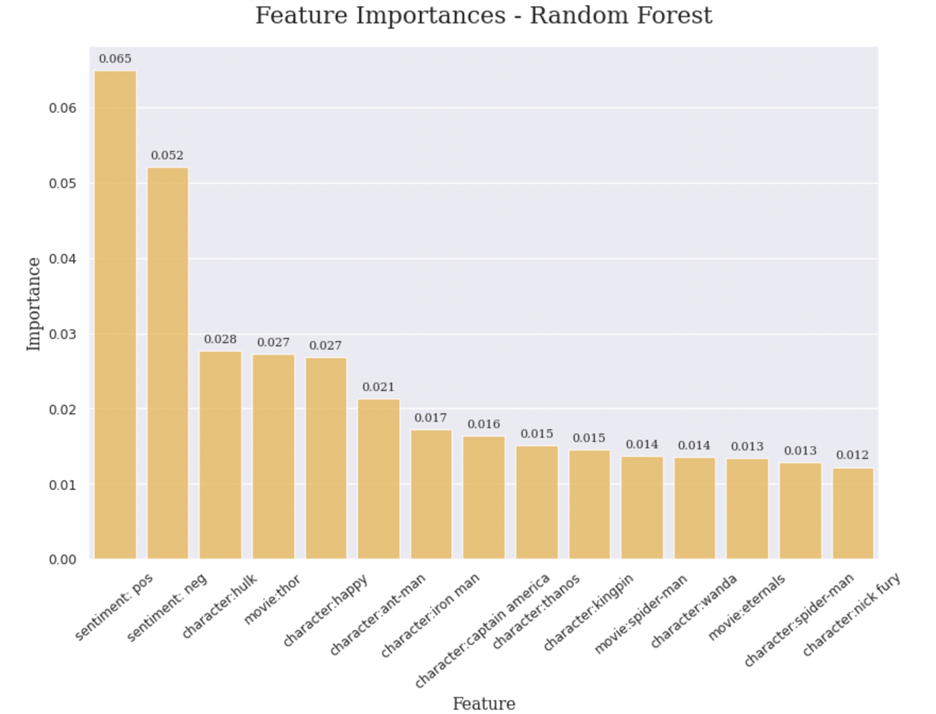
In random forest part, the feature importance chart only indicates how good are these features in separate different score. Sentiment is very important in random forest classification since they are the top 2 factors among all. For the rest features, Hulk, Thor, Ant-man and Iron-man are very important characters in the score of the comments. That means Marvel fans pay attention on these characters or related medias. Not necessarily favor but at least when some users post a submission on Reddit, it will receive either up votes or down votes, or in other words, they are the characters that do not have much controversy.
All in all, the interpretations on these two models give Marvel valuable business insights on what characters or which series should be invested. Marvel fans would prefer some specific characters like Ms. Marvel and Nick Fury, so maybe it is a good opportunity to make more stories and product around these characters. While some other characters may not be a good choice to continue, like the Eternals.
IMDB Rating Prediction - Movies and Disney Plus Series
Business Goal: Observe the relationship between the users' opinion of each media reflected by the Reddit data and the IMDB Rating.
In this part, we tried to use Linear Regression and Lasso Regression to find out whether the score and sentiment for posts of each media are correlated to its IMDB rating data and evaluate the performances of different hyperparameters and models. We had planned to use the same technique to predict the heroes' popularity based on his/her/its backgrounds and ethnicity. But the performance reflected by R-Square was too bad and nonsense, due to the discrete data. At the same time, we think that as a social media platform, it is very important for Reddit to precisely grasp the trend direction and audience’s preference of movies and TV Series. So, we changed the goal to the new one.
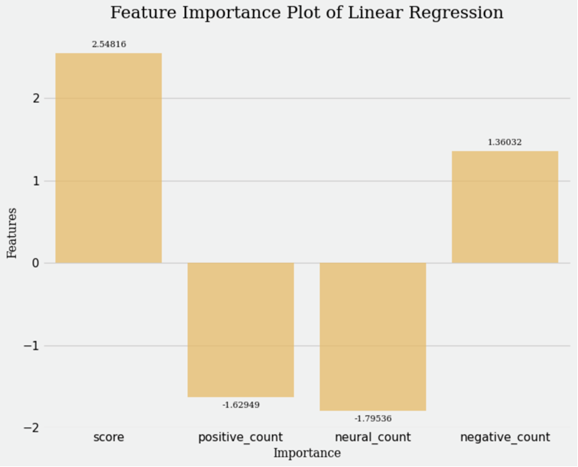
We collected the IMDB Rating data from the external website and separately calculated the Reddit score data and the count of positive, neutral, and negative posts related to each media. With these data as features and IMDB Rating data as target, we first used linear regression to reveal the feature importance so that we could know the correlation between score/sentiment and IMDB Rating of each media. Score means the agreement of each post in Reddit. It directly reflects the attitude given by other users. The model reflects that for each media, the higher the total score of the post mentioning it, the higher its IMDB score, which briefly means that the users' and fans' opinion on each media is consistent with its professional review. What is surprising is that the count of positive posts has a negative impact on IMDB Rating while the count of negative posts has a positive impact. It may because the sentiment of some posts may be for the characters, production, and off-site factors of some medias, rather than for the media itself, which is difficult to be distinguished during sentimental analysis. However, it cannot be ruled out that due to the limited time range of the reddit data we can collect, the number of movies released during this period is only 14 which is not that enough for a regression model, so the analysis results may be not representative enough, and the value is also limited.
| Model - Train/Test | RMSE | MAE | R-Squared |
|---|---|---|---|
| Linear Regression - Train | 0.19 | 0.15 | 0.66 |
| Linear Regression - Test | 0.57 | 0.47 | -1.99 |
| Lasso Regression - Train | 0.33 | 0.25 | 0.00 |
| Lasso Regression - Test | 0.55 | 0.44 | -1.79 |
| Tuned Lasso Regression - Train | 0.21 | 0.17 | 0.58 |
| Tuned Lasso Regression - Test | 0.56 | 0.44 | -1.82 |
By using the regression models, we also calculated the related metrics to evaluate the performances. Quality of the prediction by using linear regression and the training data is the best. It has the lowest MAE, MSE, and RMSE, which revealed the predict accuracy and the best R-Square which represents the model fit. This is because relatively speaking, the training data set is larger and more diverse, so the results are more meaningful. Among all these models, the performance of Lasso Regression is the worst. So, we imported the LassoCV method to automatically tuned the hyperparameters and significantly improved the quality of fit based on the R-Square value. As you can see in the metrics table, we used both training and testing data to conduct the prediction. Generally, the prediction of training data is better than the one of testing data. For the R-Square value, apparently there are some abnormal values that lower than 0 for the test data prediction. The reason is that the test dataset volume is too small, so the models are easily to be overfitted.