Executive Summary
The business objective was divided into two pieces after checking the primary text dataset (subreddit-Marvelstudio). One focuses on Marvel's media, the other on its characters. We locate two external datasets that are attempting to extract more data in order to facilitate our purpose. For each of the three datasets, we perform exploratory data analysis to identify the time period, mentioned frequency, and general distribution. This will involve a fascinating initial investigation of business objectives.
Data Process
Data cleaning is task-specific and it needs to have a strong idea about what we want our end result to be and even review the data to see what exactly goal can be achieved. In data processing, we report the basic information about the Reddit dataset to find the interesting columns, the schema of the dataset, the number of rows we have and etc. Then, we conduct basic data quality checks! Make sure there are no missing values, check the length of the comments, remove rows of data that might be corrupted. Even if we think all our data is perfect, we still demonstrate that with our analysis. Based on above, we use data transformations to make some new variables that are relevant for our business goals. To create dummy variables and data relating to our business questions, implement regex searches for targeted terms of interest.
To more effectively advance the inquiries we wish to pursue, we find some type of external data about Marvel Studio media and characters to join onto our reddit data. The external datasets are consider a time-related dataset. Box office and investment over time, media release date, specific media and characters background and etc. In order to effectively utilize the data We make custom datsaets that are derived from our reddit data and combine it with the processed external datasets. This step gives us for a accurate, defensible data that generates reliable visualizations, models, and business decisions.
Analysis Report
We separated the analysis report part into three blocks (Reddit data/ Media/ Character) and illustrated the comprehension with tables and diagrams based on the workflow of data cleansing and the distribution of business goals.
Reddit Data
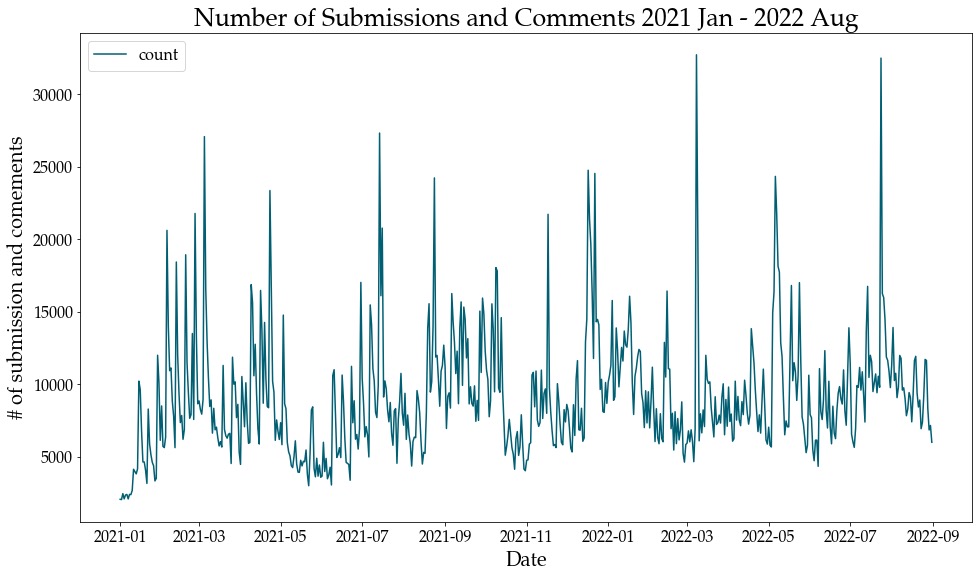
This graph is time seires focused. The horizontal axis is the time block of discussions in Marvel Studio subreddit, and the vertical axis is the number of discussions by reddit users. From the graph we can see that there are two discussion peaks in March 2022 and August 2022 respectively. This is because in these two time periods, Marvel movies released four movies. Compared to other months, the number of movies and series releases in these two months is higher. People's discussion heat will change with the time of the movie release.
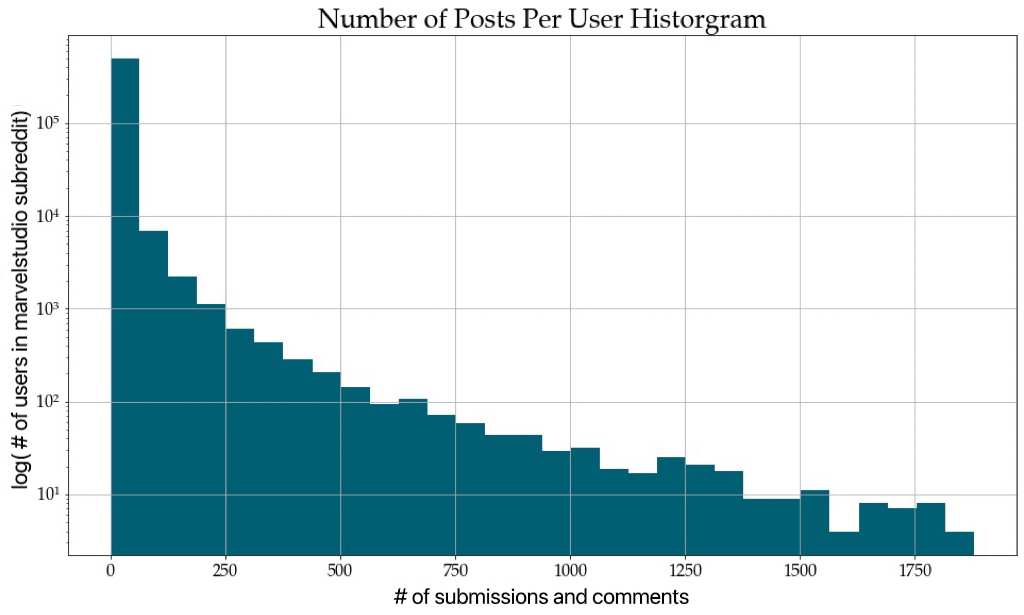
For subsequent analysis of issues related to user discussion, we generated a histogram of the number of posts made by each Marvel Studio subreddit user. It helps viewers to see and understand quickly and easily essential meanings and patterns related to a large amount of Reddit data. This graph offers an insightful look at frequency distribution of posts per user. The horizontal axis represents the number of user posts and the vertical axis represents the number of posting users. As can be seen, a very large portion of users post between 1-60 times, while a very tiny fraction post more than 1750 times. This may be related to the various sentiments that reddit users have with Marvel Studio, and it offers some thoughts to consider as we develop our business goals.
Media
Media Information Summary
| Index | Media_name | Release_date | Is_movie | Box_office(USD) | Investment(USD) | Mention_count |
|---|---|---|---|---|---|---|
| 0 | spider-man | 2021-12-17 | True | 1.916307e+09 | 200000000 | 133711 |
| 1 | loki | 2021-06-09 | False | NaN | 225000000 | 132231 |
| 2 | thor | 2022-07-08 | True | 7.607553e+08 | 250000000 | 59422 |
| 3 | wandavision | 2021-01-15 | False | NaN | 200000000 | 49710 |
| 4 | eternals | 2021-11-05 | True | 4.020649e+08 | 200000000 | 45844 |
| 5 | Hawkeye | 2021-11-24 | False | NaN | 150000000 | 41987 |
| 6 | black widow | 2021-07-09 | True | 3.797517e+08 | 200000000 | 40495 |
| 7 | what if | 2021-08-11 | False | NaN | 150000000 | 31266 |
| 8 | doctor strange | 2022-05-06 | True | 9.557758e+08 | 200000000 | 25062 |
| 9 | moon knight | 2022-03-30 | False | NaN | 150000000 | 23290 |
| 10 | shang-chi | 2021-09-03 | True | 4.322433e+08 | 150000000 | 20818 |
| 11 | ms marvel | 2022-06-08 | False | NaN | 150000000 | 19844 |
| 12 | she-hulk | 2022-08-17 | False | NaN | 225000000 | 2479 |
| 13 | the falcon and the winter soldier | 2021-03-19 | False | NaN | 150000000 | 2479 |
This customized table is based on processed reddit data and external media data. It contains relevant information about the movies and TV series produced by the Marvel Studio. We have chosen all of the media that was made available throughout the posting period on the marvelstudio subreddit. Six movies and eight series make up the total of 14 movies and series. To create a comprehensive table of media, the release date, box office, investment, and amount of subreddit references for each movie and series were merged. This table gives us a variety of detailed and accurate data that contributes in the analysis of our business goals.
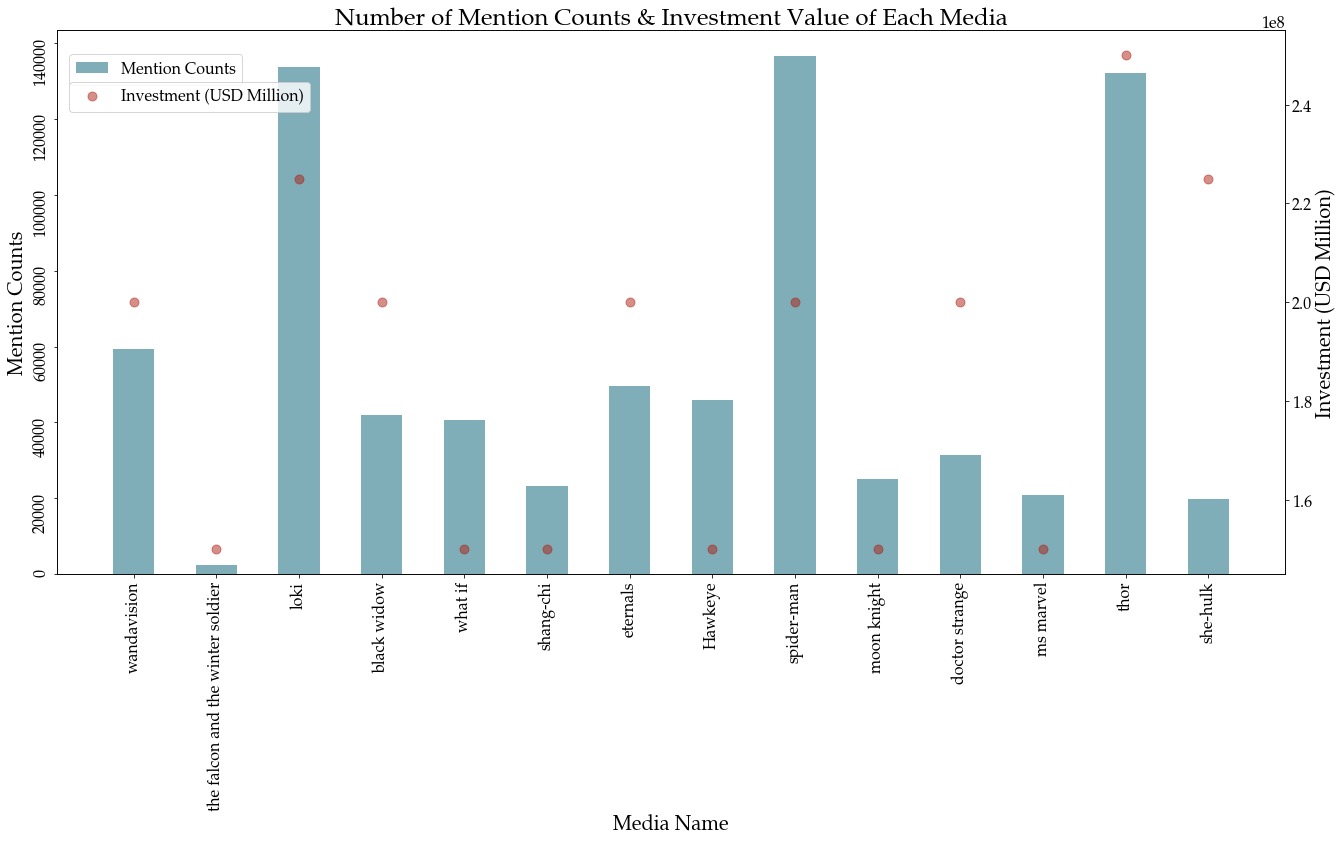
Based on the aforementioned table and a general understanding of the film business. We want to illustrate the relationship between each media and the relevant variables. A dual axis histogram is used to show the number of mentioned counts and the investment of each media. The scale of the first Y-axis reflects the mentioned counts for the associated media name., and the second Y-axis on the right-hand side of the histogram is the investment of each media. This graph shows the different scale of mentioned count and investment for the same scale media name and lets viewers compare two dissimilar series of data on the same chart without overemphasizing the importance of the larger series.
The information that can be extracted from the diagram provides a great help in constructing our business goals. We can see that "the falcon and the winter soldier," which has received the least attention, also has the lowest investment, while "thor," which has received the most attention, has received the most investment. Whether the popularity of a film or TV production is proportional to its investment is a question we will explore later.
Character
Count of Alignment
| Alignment | Count | Avg(mention_count) |
|---|---|---|
| good | 19 | 45964.63157894737 |
| bad | 10 | 52022.9 |
| unknown | 21 | 7527.571428571428 |
For the section on Marvel characters, we grabbed data based on characters from media released during the reddit user posting period. Based on the reactions of Reddit users to each character, we categorized the characters from media into three categories: good, bad, and unknown. The alignment of the associated characters were separated into group, and the average of the number of mentions by Reddit users was calculated.
The powerstats of Marvel heros
| Summary | Intelligence | Strength | Speed | Durability | Power | Combat |
|---|---|---|---|---|---|---|
| min | 38 | 6 | 8 | 10 | 13 | 30 |
| 25% | 63 | 12 | 23 | 42 | 29 | 64 |
| mean | 77.24137931034483 | 46.172413793103445 | 39.172413793103445 | 64.34482758620689 | 63.06896551724138 | 75.86206896551724 |
| 75% | 90 | 83 | 53 | 95 | 100 | 90 |
| max | 100 | 100 | 83 | 100 | 100 | 100 |
| stddev | 17.887855362175983 | 35.36550878783819 | 19.88910140453316 | 29.840379955055347 | 32.5762084903371 | 17.7718158448608 |
Each Marvel movie character has unique heroic ability attributes based on the genre of Marvel media. To track the characters' relative powers, we built a statistical table from external character data. The five categories of intelligence, strength, speed, durability, power, and combat are used to categorize the hero's power status. The table shows the minimum, 25th percentile, mean, 75th percentile, maximum, and standard deviation of each attribute.
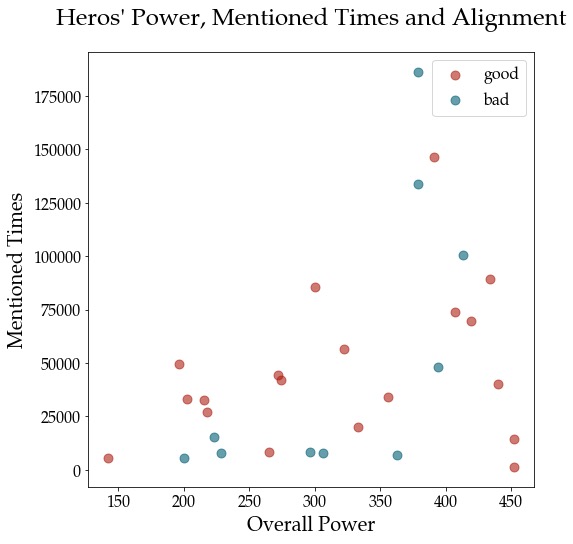
The scatter plot was produced by generating the two superhero-related tables mentioned above to observe and show relationships between the number of times a character was mentioned in the movie and the character's power status. The horizontal axis represents the sum of the hero's power status, and the vertical axis represents the number of times the hero was mentioned by reddit users. The good and bad sides of the hero are represented by the colors red and blue, respectively.
We can see that the heroes of goodness have a greater advantage in terms of the quantity of colors. The number of mentions and a hero's level of power are not significantly correlated. The level of public sentiment and discussion around a hero can be inferred to be s omewhat unrelated to the powerstats of the hero. This gave us a new perspective and allowed us to continue thinking about character-related business questions.